
The last article of this series will present the fingerprinting method. It does not use actual fingerprints but rather prints of wireless networks around a building. This will allow us to determine a location with a to-the-room accuracy in the building. Let’s see how it’s done!
Localization with to-the-room accuracy fast and easy (4/4)
We’ve already discussed Dead Reckoning and Multilateration. Now, we have arrived at the Fingerprinting method and that will be the last method we’ll present in this series. It is completely different from the previous ones.
Finger… prints?
Prints, not the best thing to use to determine a location in a building, right? Having a 3D floor plan, i.e. a model of the building, is quite impractical and unrealistic. Fortunately, this method is not about making prints of floors but of places.
Looking around corridors in various buildings, you’ll notice that they are often very similar. There’s not much variance to it. You can’t say about a specific place in the corridor that it has a print (i.e. model) and that there’s no place similar to it in the building, right? Actually, the opposite is true. Every place is unique, we just can’t see it. Local Wi-Fi accessible in buildings can but doesn’t have to have the same name when accessed from various access points.
Let’s take the corridor example. If the corridor is long, you need several access points to have a signal everywhere. So even if the corridor looks the same, you can divide it into parts that are covered by the signal from various access points. Applying this to the whole building with many access points, you’ll come to the conclusion that you can clearly identify every location in the building by its Wi-Fi network print, similarly as you would identify a person by their fingerprints.
Location print
What is a location print? For the purpose of this article, the location print will represent the Wi-Fi network print, a list of signals received from various access points and their strengths. That’s it.
You’ll notice that we have prints of locations from all over the building. What can you do with them? What will happen when users want to find their location in the building? First, you’ll need an accessible database of the collected prints. And it doesn’t matter if it’s on a server or directly in the users’ phones.
What’s the easiest way to find the most suitable prints? By creating one…
If you have a database of various prints of locations from all over the building, the best way to determine your location is to create a new print and compare it with the existing ones. Sometimes you only need to compare it with the closest or most similar one. But how do you compare the prints? You’ll have to implement some beautiful math…
Multidimensional hell
This is probably the most challenging part of the whole series – a method to compare the prints. You have to compare vector size, simply put. But an individual vector has as many dimensions as there are access points in the building.
So if you apply this method in a building with dozens of access points, you’ll get something that, at first glance, looks like a multidimensional jungle. But it’s not that bad as you can find similarities to real life even in this jungle.
Let’s take a few boxes that vary in sizes as an example. All of them are simple objects with certain dimensions. These are represented by a set of x, y, z values in three dimensions. Length, width and height.
Every box can be defined by a point in a Cartesian system that defines its size relative to the point of origin. If you place a corner of the box at the origin, the point you get is located on the opposite corner, defined by a spatial diagonal that passes through the origin. This makes it the furthest point of the box from the origin. The diagram is, as usual, only two-dimensional but this principle applies to any number of dimensions.
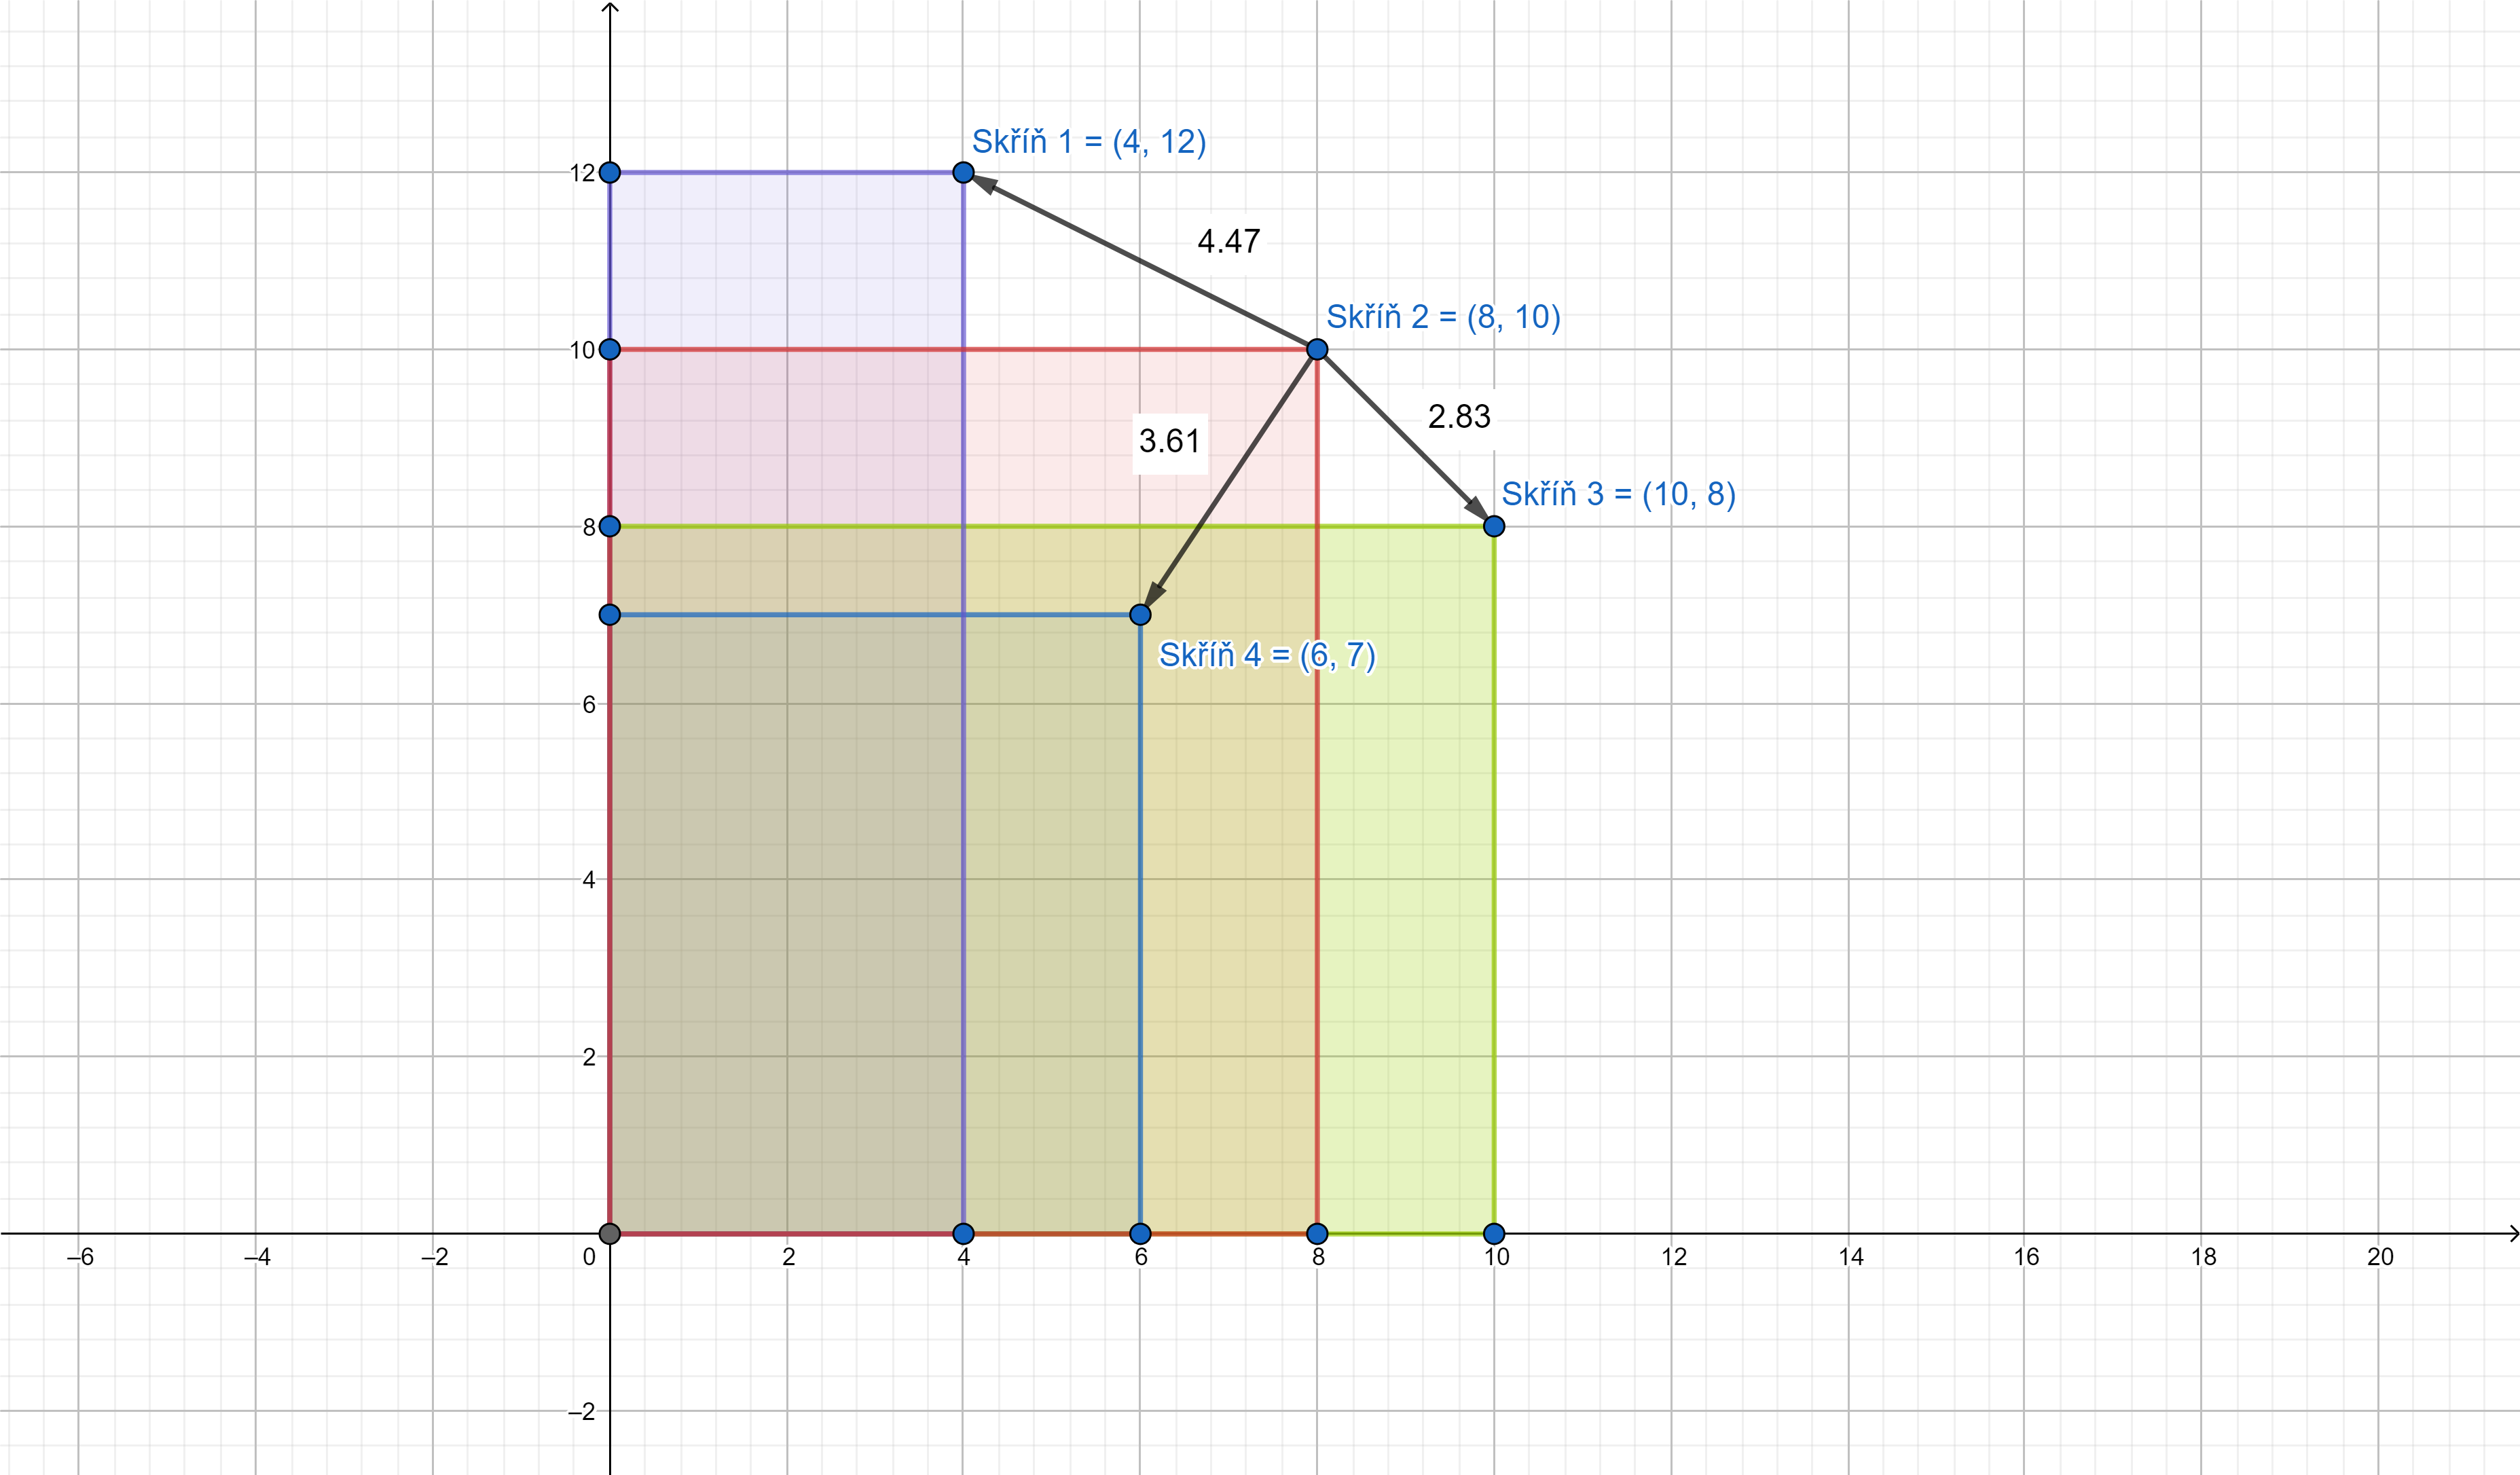
How do you find out which boxes are the most similar in size? You can take volume as a good quantity for the comparison. But there’s an issue as you will get results stating that the tallest boxes are very similar to the widest ones. And that’s not correct. That’s why the best descriptive element of each box is the point you discovered. Because that point clearly defines the box’s shape.
So how do you compare these? You have one box which must be compared with all others. You have one point which must be compared with all others. In other words, you have to find the closest point to the designated one. Analytical geometry comes in handy for this task. Let’s create vectors with one point set (a specific point; the box you are comparing to) and the other point will be the individual remaining points (i.e. remaining boxes). If you were to draw this on paper, you’d get quite a lot of lines. You could also clearly see the lengths of the individual vectors. Unfortunately, the computer doesn’t see as clearly as you do. And that’s why this has to be translated into numbers.
What do you do with a vector you already have? Calculate its size… When you have the size, you can compare one to another. And just like magic, the shortest vector will give you the most similar box!
You can use the same idea to get the closest location from the database of the prints. You’ll only use the received values from various transmitters instead of vectors. An important thing to note is that you don’t even need to get a signal from all receivers. How do you compare these? You’ll create a vector and calculate its size. But is there an equation to calculate the size of such a vector? If you compose the vector, then yes. Our favourite is this one:

It looks quite difficult with all the sums and exponentiations, but it actually isn’t. It just says: “Calculate the deviations of the individual dimensions, square them, add them up and find the root.” It’s an Euclidean distance or, in other words, the mathematical Euclidean metric. We like it for it is one particular case: Its two-dimensional version is called the Pythagorean theorem. Beautiful, isn’t it?
And if you have the size calculated, you can easily find the closest space. Unfortunately, like all the previously presented methods, even this one has its flaws.
The world of ideal mathematics encounters reality
As we mentioned, you need the database of the prints. Articles about how to create such a database would make up its own series, therefore we’ll stick to the basics for now. First and foremost, you need as many prints as you can from various devices.
Each phone receives signals differently. That’s why it’s recommended to save the phone type and its location in the space into the print, as it can play an important role. It’s also good to collect the prints several times over a given time-frame. E.g. in the morning, at noon, and in the evening. Because when we were programming this method, we discovered that the transmitters in the building were adjusting their transmitting output based on the demand. Four transmitters were enough to cover the whole building during the evening but around noon six times the number was needed.
How dense do the prints in the database need to be? Generally, we’d recommend around two meters each, based on our empirical research. It’s a very sturdy method.
But when you create so many prints, that puts quite a load on the computing power, right? Well, yes and no. If you’re going to compare all prints then yes, as there can be millions of them. If you filter, e.g. by the MAC address of the received access points, you can reduce a few million prints to a few thousand. And if you add a time filter on top, e.g. two-hour time frame, you can further reduce the number to hundreds. And that’s not a huge volume at all.
This method is solid even if an access point gets replaced. Should that happen, the calculations are not influenced by a huge margin. Because all prints will account for the same deviation that, all in all, doesn’t have much influence on the result. But all this boils down to one important thing – the database needs to be regularly updated!
To-the-room accuracy
Accuracy, the alpha and omega of all of these methods. As the title suggests, this method has an accuracy of around six to seven meters in an open space. Like long corridors or similar rooms. It won’t tell you where a user is in the room. But it will tell you in which room the user is. And that’s usually sufficient.
Conclusion
That’s all folks. We hope that this series clearly presented the principles and approaches to this interesting topic. Yes, the mentioned approaches are far from ideal but combined together, they could create a very interesting product… 😉
How did we get to this tricky topic you ask? Well, school is to blame, specifically my bachelor’s thesis, for which I had to study the whole field which resulted in creating a smartphone application for Android that determines the location using fingerprints. Afterwards I had a few lectures in the company on this topic and this series is the latest outcome. And that’s what I value about eMan. Even if you are a junior, you can represent the company and write blog posts. It doesn’t matter if you are fresh from school or a senior with a dozen years of experience. What matters is that you have something interesting to say.